A Quick Index for Feature Engineering
Feature creation and extraction
- Data type
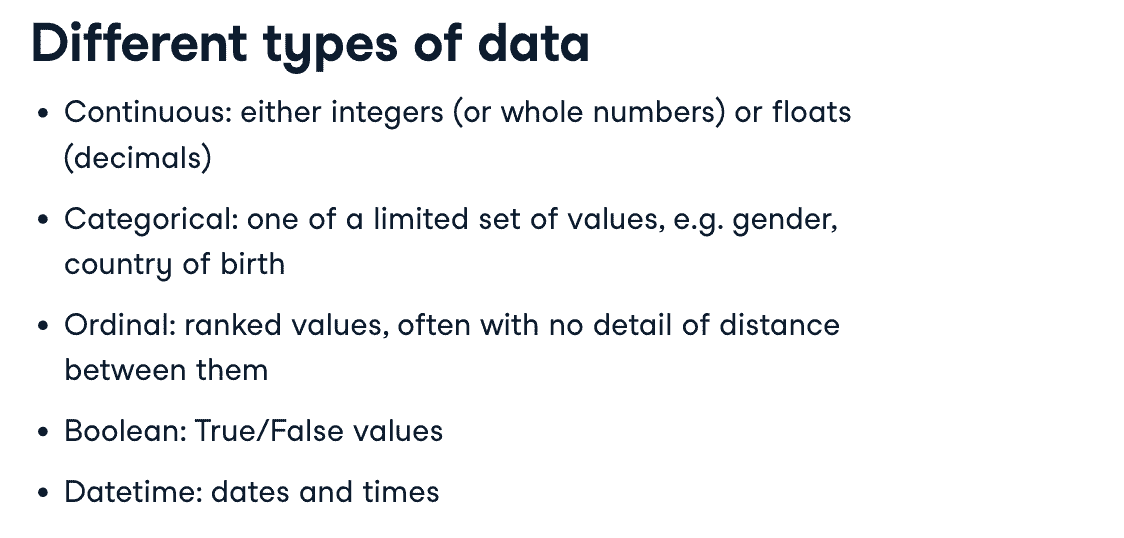
handle categorical variables
Categorical variables are used to represent groups that are qualitative in nature.
- Encoding method:
- One-hot encoding
- Dummy encoding
One-hot encoding: Explainable features
may lead to 共线性(Collinearity)
为了避免共线性对回归模型的影响,可以采取以下措施:
- 直接移除高度相关的自变量。
- 通过主成分分析(PCA)等方法对自变量进行降维。
- 使用正则化技术(如岭回归或lasso回归)来惩罚回归系数,以减少自变量之间的相关性。
- 增加更多的样本或特征(如采用更多的控制变量)可能有助于减少共线性的影响。
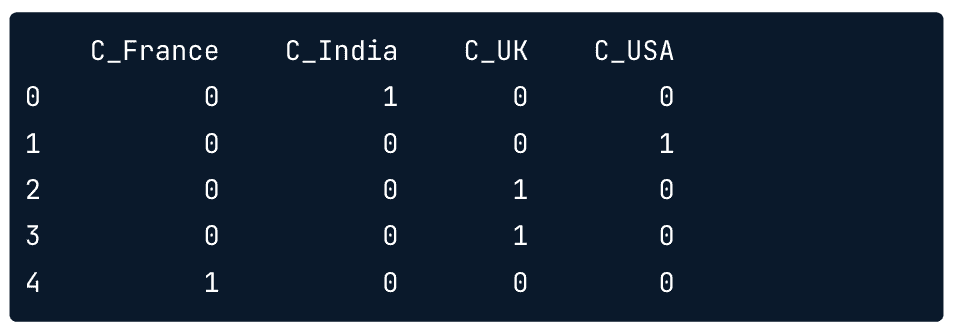
pd.get_dummies(df,columns=['Country'],prefix='C')
Result:
在使用
pd.get_dummies()函数对 DataFrame 进行操作时,不指定的列将不受影响,并且会被保留在返回的 DataFrame 中。因此,如果您有一个名为df的 DataFrame,其中包含一个名为aa的列,并且您对Country列进行编码,则编码后返回一个的 DataFrame 将包含未编码的aa列和编码后的Country列的所有行,原有Country列删除。
Dummy encoding: Necessary information without duplication
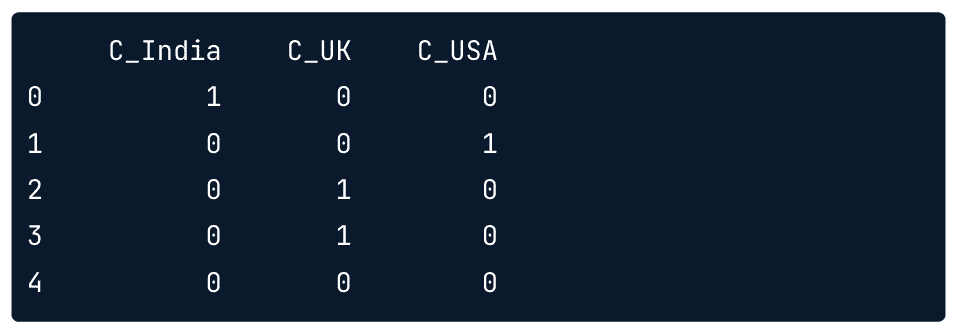
In dummy encoding, the base value, France in this case, is encoded by the absence of all other countries as you can see on the last row here and its value is represented by the intercept.
pd.get_dummies(df,columns=['Country'],drop_first=True,prefix='C')
Result:
Limiting colums
一直用get_dummies可能会产生大量的列,因此我们可能希望只创建常见的分类
counts = df['Country'].value_counts()
// 创建少于五次出现国家的mask
mask = df['Country'].isin(counts[counts<5].index)
df['Country'][mask]='Other'
handle numeric variables
Questions before your handling:
-
Dose size matter ?
-
对于有的特征,我们不关心数字大小,只关心是否非零(比如违规次数),可以01编码
-
df['Binary_violation'] = 0
df.loc[df['Number_of_Violations']>0,'Binary_violation'] = 1
-
-
Bining
-
对连续变量切片(比如违规次数)
-
import numpy as np df['Binned_Group'] = pd.cut( df['Number_of_Violation'], bins=[-np.inf,0,2,np.inf], // 左开右闭 labels=[1,2,3] ) -
so_survey_df['equal_binned'] = pd.cut(so_survey_df['ConvertedSalary'], 5)
// 等距分箱
-
Messy data
Messing data could be a important feature
handling missing data
Listwise deletion 删除有缺失值的所有行
现实中删除行不可行,test-set里面也有缺失,又不能丢
If you are confident that the missing values in your dataset are occurring at random, (in other words not being intentionally omitted) the most effective and statistically sound approach to dealing with them is called ‘complete case analysis’ or listwise deletion.
// 删除至少有一个缺失值的所有行
df.dropna(how='any')
// 删除特定列有缺失值的行
df.dropna(subset=['VersionControl'])
// 删除有缺失值的列
df.dropna(how='any', axis=1)
Replacing with value
注意:要用trainset的均值(或其他属性值)去填充testset,具体可以看:https://www.zhihu.com/question/268540071
- 替换策略:
- 对于Categorical columns:用’None’或出现频率最高的类替换
- 对于Numerical columns:用稳定中心值替换,如mean,median
- cons:it can lead to biased estimates of the variances and covariances of the features. (产生有偏估计);the standard error and test statistics can be incorrectly estimated so if these metrics are needed they should be calculated before the missing values have been filled.
// inplace 表明是否在原有df上替换
df['VesionControl'].fillna(value='None Given',inplace=True)
// 这些计算默认会排除缺失值
df['ConvertedSalary'].mean()
df['ConvertedSalary'].median()
df['ConvertedSalary'].fillna(df['ConvertedSalary'].mean(),inplace=True)
// 均值小数位多,可以转int
df['ConvertedSalary']=df['ConvertedSalary'].astype('int64')
// or Python中的round方法默认采用四舍五入规则,即当舍去部分为5时,向偶数方向舍入。
df['ConvertedSalary'].fillna(round(df['ConvertedSalary'].mean()),inplace=True)
Recording missing values
有时候,一个列是否有缺失值可能很重要
df['SalaryGiven']=df['ConvertedSalary'].notnull()
df.drop(columns=['ConvertedSalary'])
handling data issue
字符串替换
删除英文数字中的逗号
df['Salary']=df['Salary'].str.replace(',','')
改变特征数据类型
比如以上,删除逗号后,数据类型依然是字符串
df['Salary']=df['Salary'].astype('float')
df['col'] = pd.to_numeric(df['col'], errors='coerce')
// 使用to_numeric()函数将其中一个列的数据转换为数字类型。errors='coerce'参数用于指定在转换过程中遇到无法转换的数据时,将其转换为NaN值。
Normalization
Data distribution
- 除了基于树的模型,几乎所有模型都要求特征具有相同的比例(且假设数据是正态分布的)
- 但是对树模型执行min-max scaling是有利于训练速度提升的
histogram
import matplotlib.pyplot as plt
pd.hist()
plt.show()
box plots
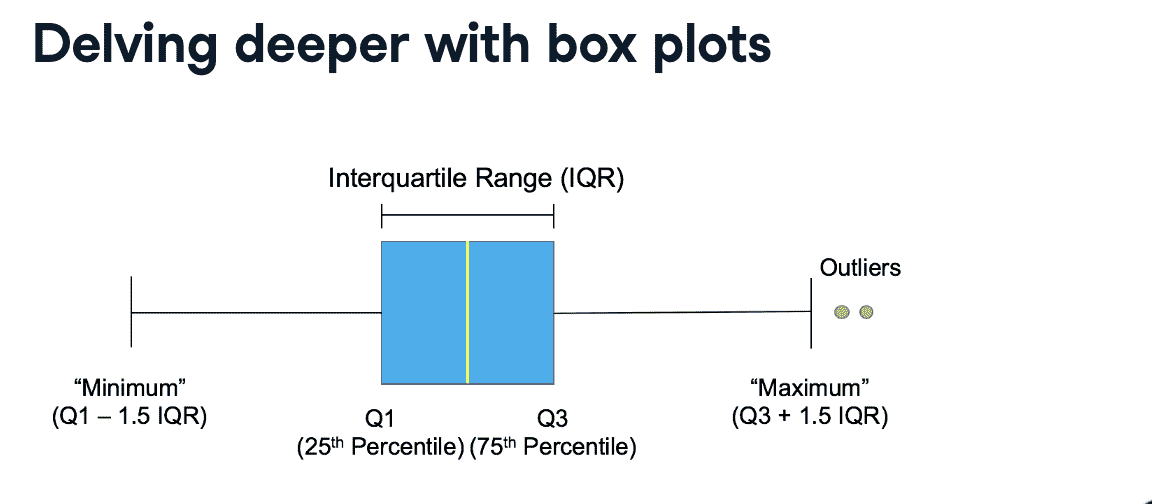
不在[$Q1-1.5IQR$,$Q3+1.5IQR$] 范围内的都是离群点(outliers)
import matplotlib.pyplot as plt
pd[['column_1']].boxplot()
plt.show()
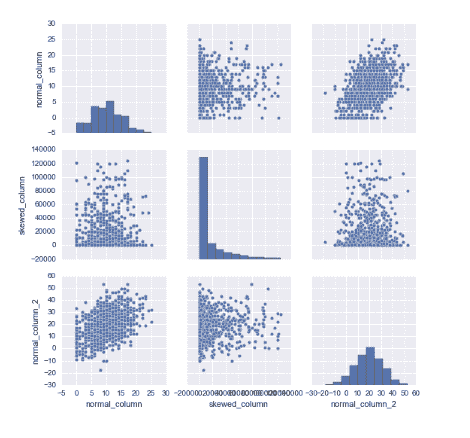
Pairplot distribution
查看不同feature之间的关联度
import seaborn as sns
sns.pairplot(df)

plt.show()
df.describe()
df.describe()
Scaling ans transformations
注意:无论什么方法,都使用训练集最大最小值进行测试集缩放:
- 在对测试集进行特征数据缩放时,应该使用训练集的最大值和最小值进行缩放,而不是使用测试集的最大值和最小值。这是因为模型是在训练集上进行训练的,训练集的特征数据范围和分布情况更能够反映模型应该学习的数据模式。因此,对测试集进行特征数据缩放时,应该使用训练集的缩放参数,以保证模型对测试集的预测能力。
- 具体来说,可以在训练集上计算特征数据的最大值和最小值,并使用这些参数对训练集和测试集进行特征数据缩放。这样可以保证训练集和测试集使用相同的缩放参数,从而使得模型对测试集的预测结果更加准确和可靠。在实际应用中,可以将训练集和测试集的缩放参数保存下来,以便在使用模型进行预测时进行缩放操作。
Min-Max scaling
-
Use when you know the the data has a strict upper and lower bound.
-
线性缩放到$[0,1]$,不会改变值的分布(只改变值的大小比例)
from sklearn.preprocessing import MinMaxScaler
scaler = MinMaxScaler()

scaler.fit(df[['Age']])

df['normalization_age'] = scaler.transform(df[['Age']])
Z-score scaling (Standardization)
- 对最大最小值没有限制,主要决定于数据的偏离程度
from sklearn.preprocessing import StandardScaler

scaler = StandardScaler()

scaler.fit(df[['Age']])

df['standardized_age'] = scaler.transform(df[['Age']])
Log transformation
- 用于右长尾分布,是skew data不那么偏斜(比如用于工资这种特征)
from sklearn.preprocessing import PowerTransformer

log = PowerTransformer()

log.fit(df[['Salary']])

df[log_salary'] = log.transform(df[['Salary']])
Removing outliers
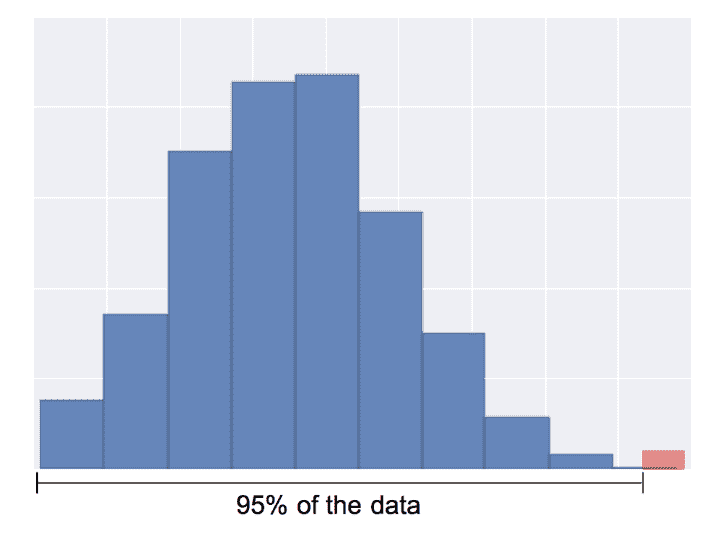
Quantile-based detection
基于分位数进行删除
缺点:但是总会删除一部分数据,即使不是极端值
q_cutoff = df['col_name'].quantile(0.95)  // 找到从小到大排序95%数据的分位点
mask = df['col_name'] < q_cutoff
trimmed_df = df[mask]
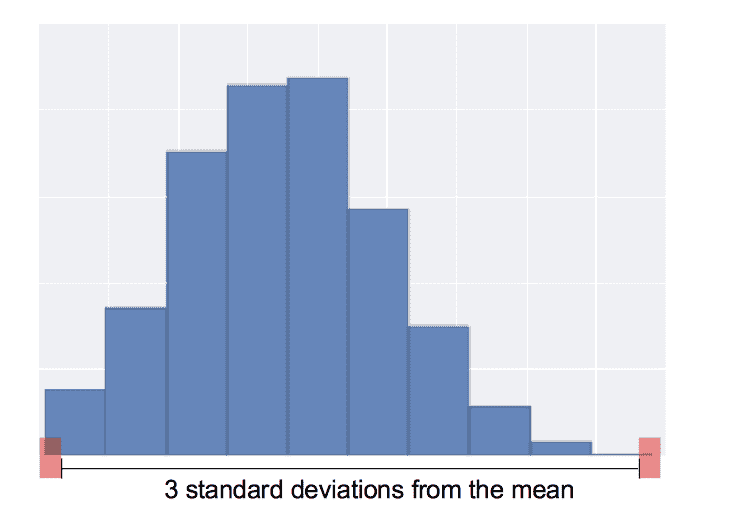
Standard deviation based detection
这个方法只会删除真正的outlier,不会出现quantile-based deletion的恒定删除
mean = df['col_name'].mean()
std = df['col_name'].std()
cut_off = std*3

lower, upper = mean-cut_off, mean+cut_off
new_df = df[(df['col_name']<upper)&(df['col_name']>lower)]
Scaling and Transforming testset
Reuse training scalers
scaler = StandardScaler()
scaler.fit(train[['col']])
train['scaled_col']=scaler.transform(train[['col']])

...

test = pd.read('test.csv')
test['scaled_col'] = scaler.transform(test[['col']])
Reuse transformations
train_mean = train[['col']].mean()
train_std = train[['col']].std()

cut_off = train_std*3
train_lower = train_mean-cut_off
train_upper = train_mean+cut_off

//去除trainset异常值

...

test = pd.read("test.csv")

test = test[(test[['col']]<train_upper)&(test[['col']]?train_lower)]
Why only use training data?
data leakage:Using data that you won’t have access to when assessing the performance of your model
Text-type data converting
Standardizing text
Removing unwanted characters
- [a-zA-Z]: All letter characters
- [^a-zA-Z]: All non letter characters
speech_df['text'] = speech_df['text'].str.replace('[^a-zA-Z]',' ')
standardize the case
speech_df['text'] = speech_df['text'].str.lower()
length of the text
speech_df['char_cnt'] = speech_df['text'].str.len()
word count()
speech_df['word_cnt'] = speech_df['text'].str.split().str.len()
average length of word
speech_df['avg_word_len'] = speech_df['char_cnt']/speech_df['word_cnt']
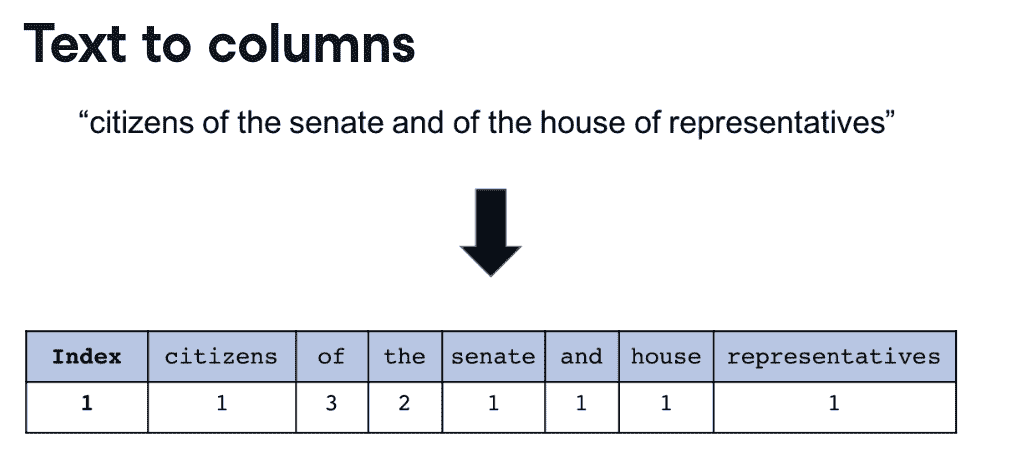
Word count representation
向量化:
from sklearn.feature_extraction.text import CountVectorizer
cv = CountVectorizer(min_df=0.1,max_df=0.9)
// min_df: minimum fraction of documents the word must occur in
// max_df: maximum fraction of documents the word must occur in

cv.fit(speech_df['text_clean'])
cv_transformed=cv.transform(speech_df['text_clean'])
// or: cv_transformed=cv.fit_transform(speech_df['text_clean'])

cv_df = pd.DataFrame(cv_transformed.toarray(),
columns=cv.get_feature_names()).add_prefix('Counts_')

speech_df = pd.concat([speech_df,cv_df],axis=1,sort=False)
TF-IDF
\[TF-IDF = \frac{\frac{Count\ of\ word\ occurance}{Total\ words\ in\ document}}{log(\frac{Number\ of\ docs\ word\ in }{Total\ number\ of\ docs})}\]词频-逆文档频率 (Term frequency-inverse inverse document frequency)
TF-IDF能够降低常用词权重,提高许多文档中不出现词的权重
from sklearn.feature_extraction.text import TfidfVectorizer
tv = TfidfVectorizer(max_features=100,stop_words='english')
// max_features: maximum number of columns created from TF-IDF
// stop_words: List of common words to omit e.g. "and",'the' etc 。english是预定义列表

tv.fit(train_speech_df['text_clean'])
train_tv_transformed=tv.transform(train_speech_df['text_clean'])
// or: tv_transformed=tv.fit_transform(speech_df['text_clean'])

tv_df = pd.DataFrame(tv_transformed.toarray(),
columns=tv.get_feature_names()).add_prefix('TFIDF_')

speech_df = pd.concat([speech_df,tv_df],axis=1,sort=False)
N-grams
之前统计词频的方法都叫词袋模型,因为没有捕捉词序信息(上下文信息)
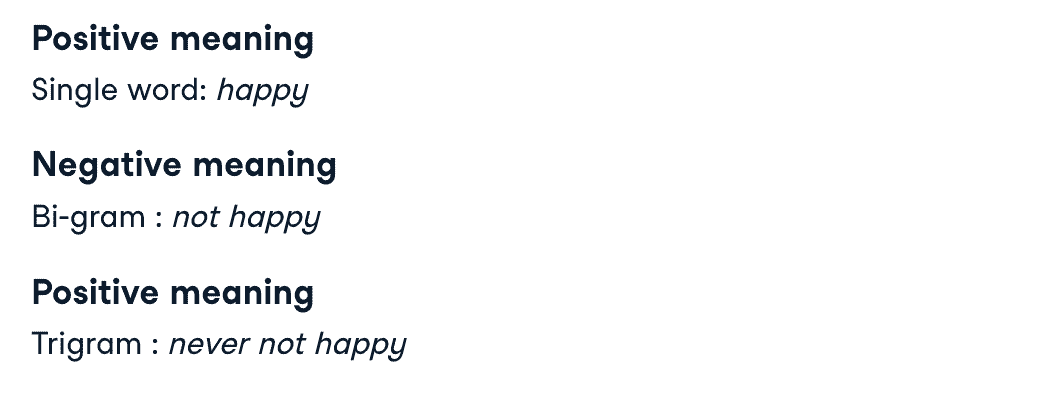
from sklearn.feature_extraction.text import TfidfVectorizer
tv = TfidfVectorizer(max_features=100,stop_words='english',ngram_range=(2,2))
// (2,2)分别代表n-gram的最小和最大长度
// max_features: maximum number of columns created from TF-IDF
// stop_words: List of common words to omit e.g. "and",'the' etc 。english是预定义列表
