[TOC]
Correlation & Autocorrelation
Correlation of percent changes
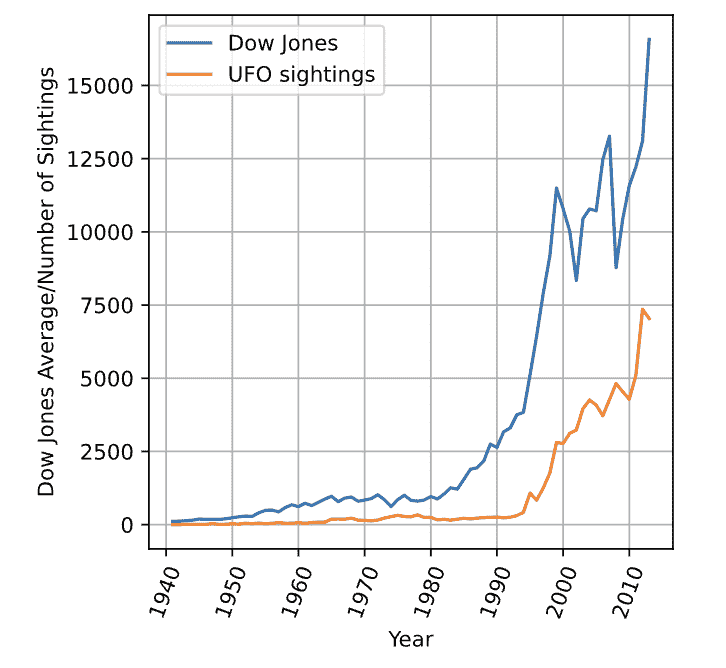
有的时候,直接计算两个序列的相关性是不可靠的。比如算Dow Jones和UFO sightings的时间序列相关可以得到0.94。所以我们得算correlation with percent changes。即计算差分的相关性,而不是实际数值的相关性。
# Compute correlation of levels
correlation1 = levels['DJI'].corr(levels['UFO'])
print("Correlation of levels: ", correlation1)

# Compute correlation of percent changes
changes = levels.pct_change()
correlation2 = changes['DJI'].corr(changes['UFO'])
print("Correlation of changes: ", correlation2)
在金融上,correlation_pct计算的是收益(价格的差分)相关性,而不是价格的相关性。
df['A'] = df['A'].pct_change()
df['B'] = df['B'].pct_change()

plt.scatter(df['A'],df['B'])
plt.show()

correlation = df['A'].corr(df['B'])
* Linear Regression
- Simple linear regression:
Odinary Least Squares (OLS):最小二乘法
- Pakages:
In statsmodels:
import statsmodels.api as sm
sm.OLS(y, x).fit()
In numpy:
np.polyfit (x, y, deg=1)
In pandas:
pd.ols(y, x)
In scipy:
from scipy import stats
stats.linregress(x, y)
- eg.
import statsmodels.api as sm

df['A_ret']=df['A'].pct_change()  // 注意返回的第一行是NaN,原因是没有差分
df['B_ret']=df['B'].pct_change()

df = sm.add_constant(df)
df = df.dropna()

results = sm.OLS(df['A_ret'],df[['const','B_ret']]).fit()

print(results.summary())

// intercept in results.params[0]
// slope in results.params[1]
为什么要加一个常数“1”列?
You need to add a column of ones as a dependent, right hand side variable. The reason you have to do this is because the regression function assumes that if there is no constant column, then you want to run the regression without an intercept. By adding a column of ones, statsmodels will compute the regression coefficient of that column as well, which can be interpreted as the intercept of the line. The statsmodels method “add constant” is a simple way to add a constant.
R-Squared & Correlation
\[\begin{aligned} & {[\operatorname{corr}(x, y)]^2=R^2 \text { (or R-squared) }} \\ & \operatorname{sign}(\text { corr) }=\operatorname{sign}(\text { regression slope) } \end{aligned}\]R方和相关系数的关系:
Autocorrelation
自相关:单个时间序列与其自身滞后副本的相关性 = serial correlation
通常说autocorrelation,一般是lag-one correlation,就是滞后一个数据的correlation
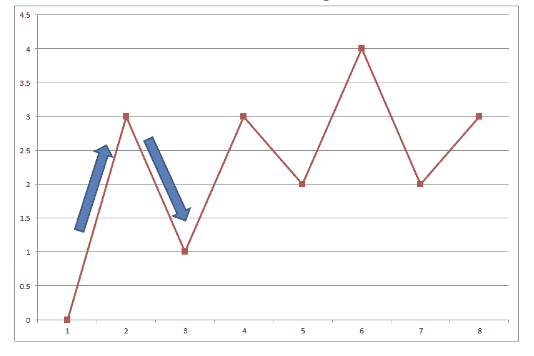
- 负自相关:Mean Reversion(均值回归)
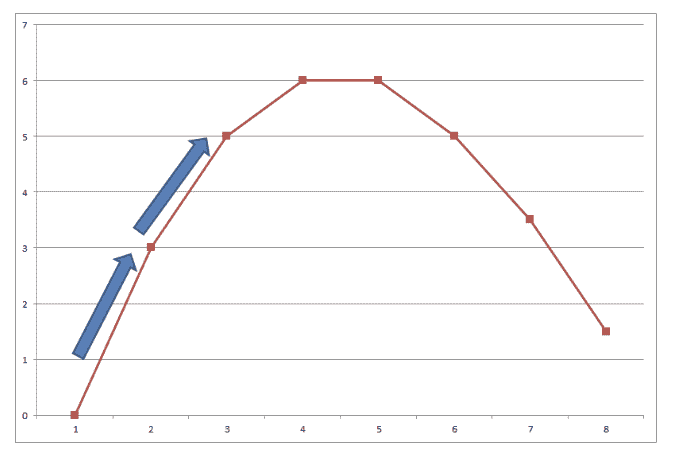
- 正自相关:Momentum,Trend Following(趋势跟踪)
- 对冲策略

# Convert index to datetime
df. index = pd.to_datetime(df.index)
# Downsample from daily to monthly data
df = df.resample(rule='M').last()
# Compute returns from prices
df['Return'] = df ['Price'].pct_change()
# Compute autocorrelation
autocorrelation = df['Return'].autocorr()
print("The autocorrelation is: ",autocorrelation)  # 0.0567
- over long horizons, when interest rates go up, the economy tends to slow down, which consequently causes interest rates to fall, and vice versa.
Sample Autocorrelation function(ACF)
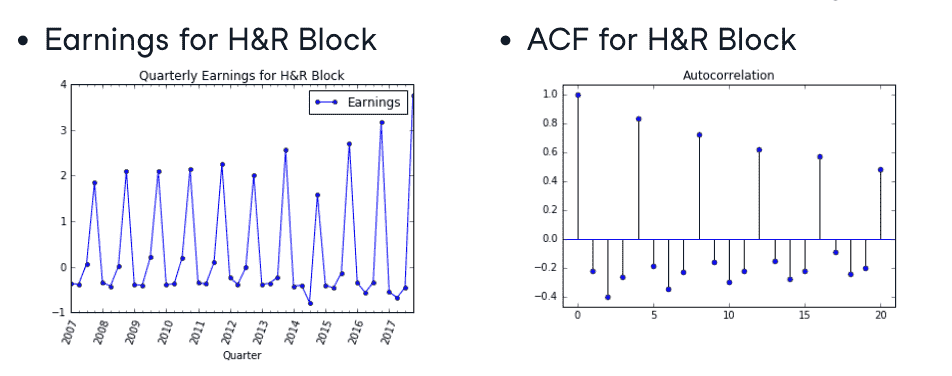
ACF shows not only the lag-one autocorrelation from the last chapter, but the entire autocorrelation function for different lags.
Any significant non-zero autocorrelations implies that the series can be forecast from the past.
sample 1: 下图显示出可以用前两个值预测下一个值(类似fib),因为lag 1和lag 2的自相关系数不为0(说明有自相关,值越大自相关越强)

sample 2: 季度性自相关
- plot ACF
from statsmodels.graphics.tsaplots import plot_acf

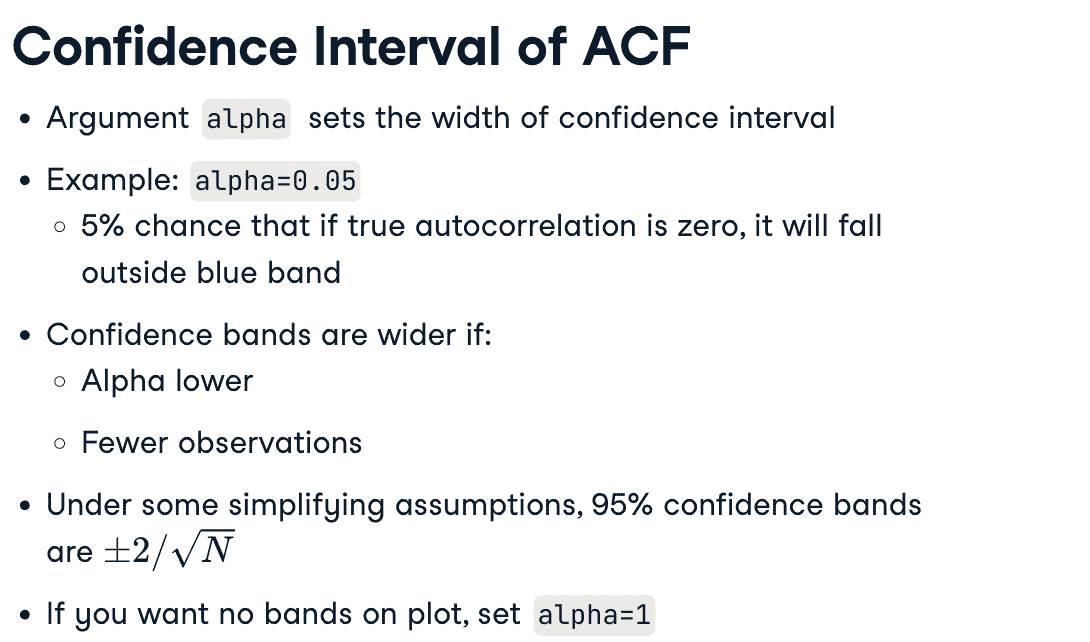
plot_acf(x,lags=20,alpha=0.05)
// lags表明绘制0~20的自相关,alpha表示置信区间

// 计算值而不是画图
from statsmodels.tsa.stattools import acf
print(acf(x))
Simple Time Series
White Noise
- White Noise except Gaussian:
- Constant mean
- Constant variance
- Zero autocorrelation at all lags
- Gaussian White Noise:
- Normal distribution
# 生成白噪声
import numpy as np
noise = np.random.normal(loc=0,scale=1,size=500) # 均值loc为0,方差scale=1

plot.plot(noise)
plot_acf(noise,lags=50)
股票returns非常接近白噪声
Random Walk
- Random Walk:
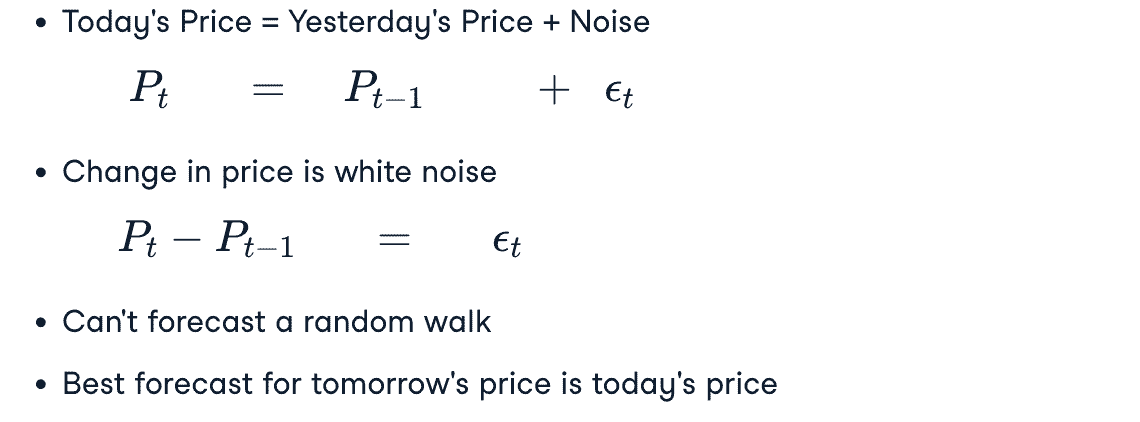
- Random Walk With Drift:

Dickey-Fuller Test
测试时间序列是否是随机游走模型
- form 1
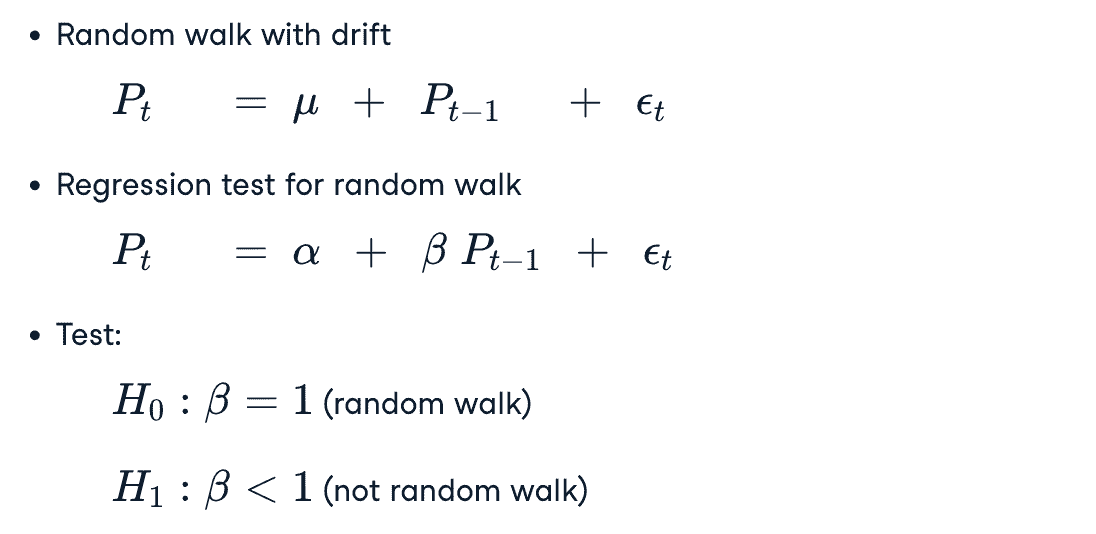
- form 2
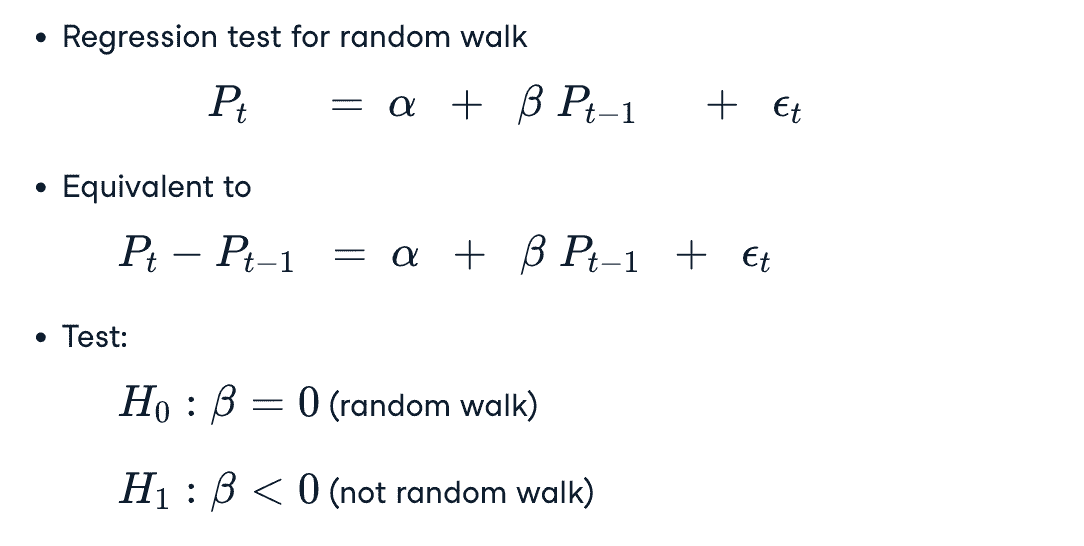
当右侧的滞后价格多于1个的时候,叫做 Augmented Dickey-Fuller Test
from statsmodels.tsa.stattools import adfuller

results = adfuller(df['SPX'])

# print the p-value
print(results[1])

# p-value 小于0.05,则可以以95%的置信度拒绝序列是随机游走的原假设
Stationarity
平稳性
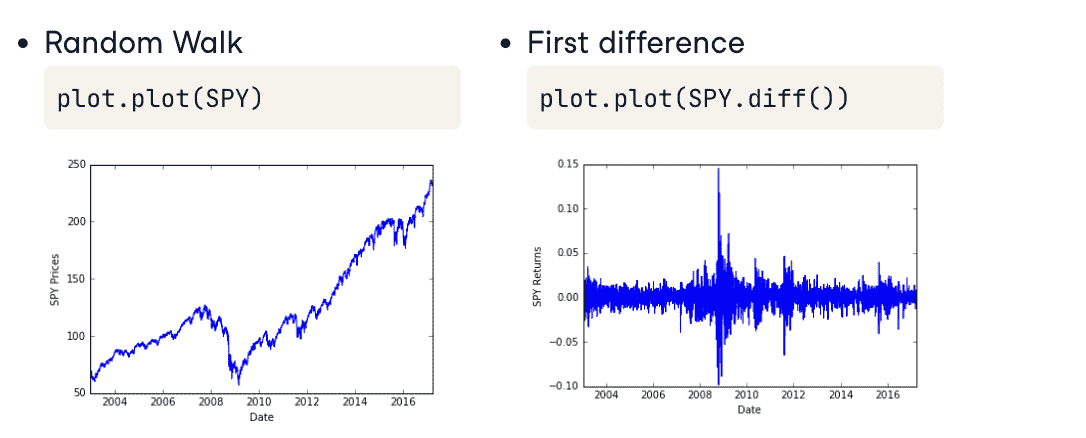
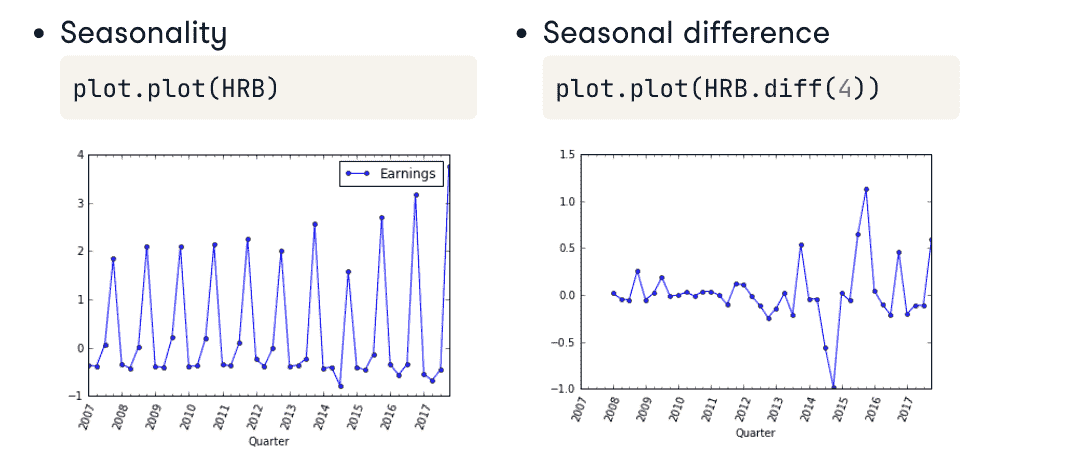
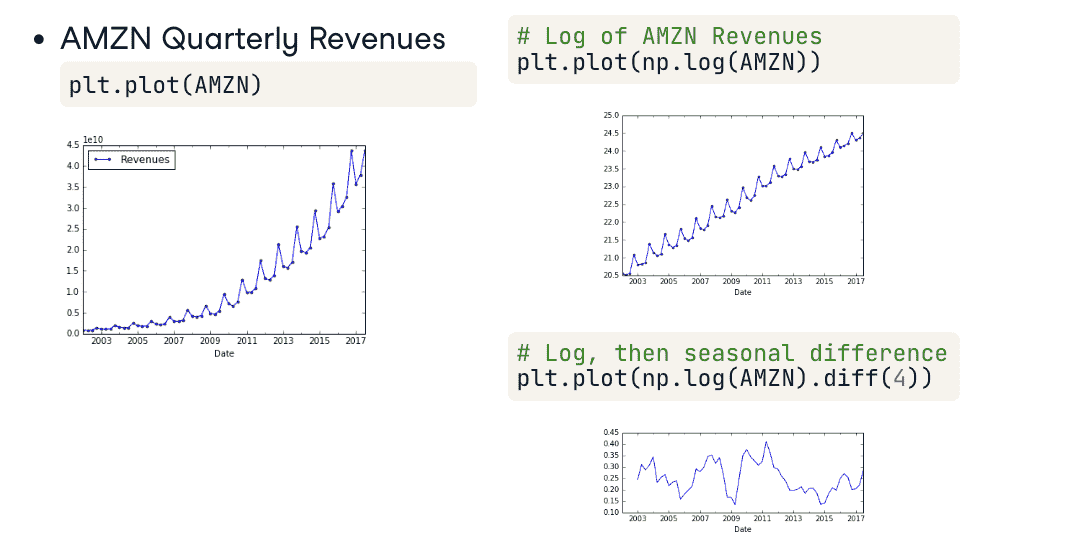
- What’s Stationarity

- 平稳的序列容易建模,参数少;而参数随时间变化的不容易建模
- unstationary 的序列可以经过转化变为 stationary的序列
sample 1:
sample 2:
sample 3:
Autoregressive (AR) Model
AR(k) model
- Methematical Description
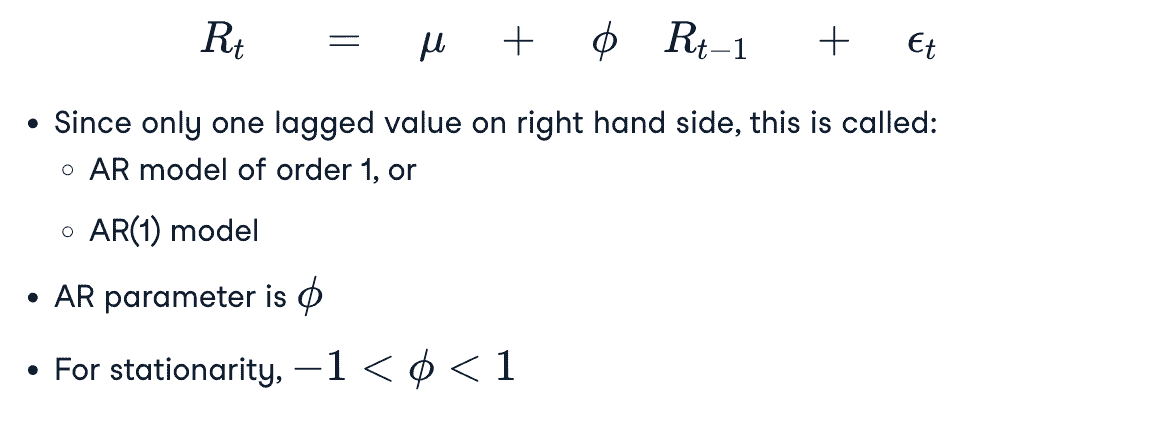
$\phi>0$ 则是 momentum 模型,$\phi<0$ 则是 Mean Reversion模型
- exponential decay of autocorreletion
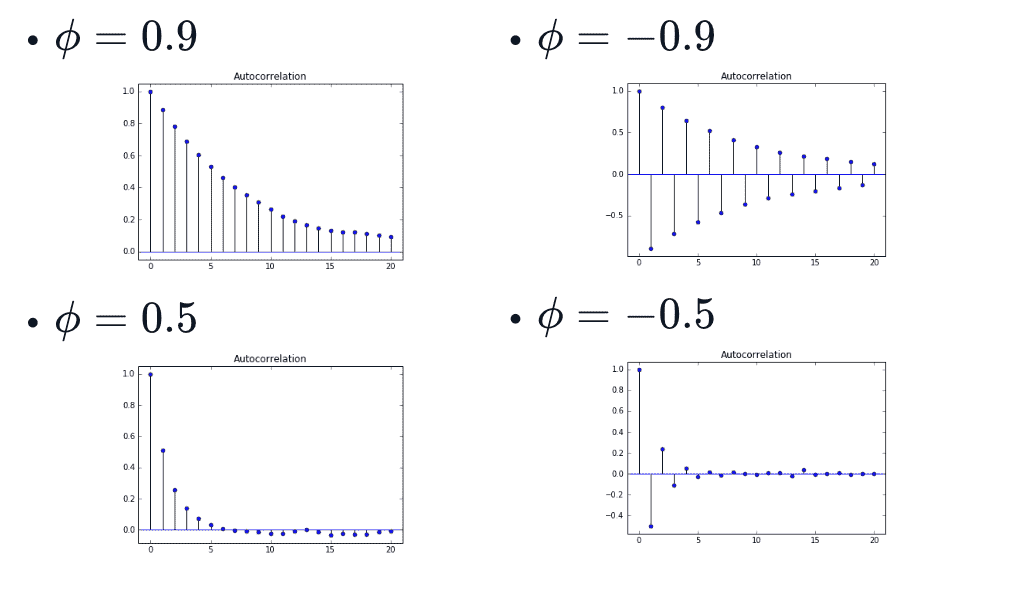 \(auto\_correlation(t)=\phi^{t}\)
- Higher Order AR models
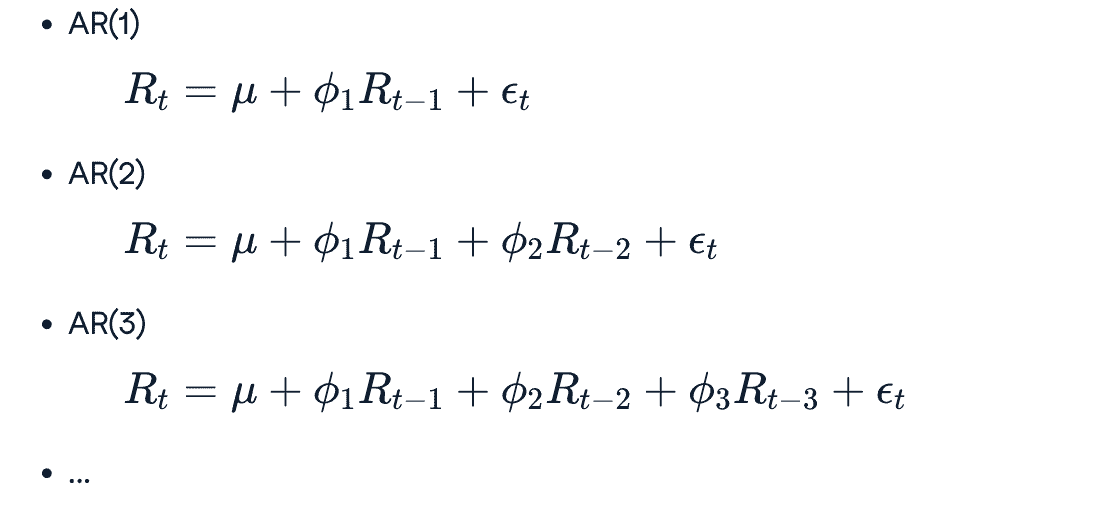
from statsmodels.tsa.arima_process import ArmaProcess
ar=np.array([1,-0.9])
ma=np.array([1])
AR_object = ArmaProcess(ar, ma)
simulated_data = AR_object.generate_sample(nsample=1000)
plt.plot(simulated_data)
Estimating and Forecasting AR model
- Estimating
from statsmodels.tsa.arima.model import ARIMA
mod = ARIMA(data,order=(1,0,0)) // order = (p,d,q), 代表ar步长、d代表差分阶、q代表ma
result = model.fit()
print(result.summary())

print(result.params)  //返回的第一个值是\mu,第二个值是\phi
- Forecating
from statsmodels.graphics.tsaplots import plot_predict
fig, ax = plt.subplots()
data.plot(ax=ax)
plot_predict(result, start='2012-09-27',end='2012-10-16',alpha=0.05)
plt.show()
- 画多个图的方法
# Import the plot_acf module from statsmodels
from statsmodels.graphics.tsaplots import plot_acf

# Plot the interest rate series and the simulated random walk series side-by-side
fig, axes = plt.subplots(2,1)

# Plot the autocorrelation of the interest rate series in the top plot
fig = plot_acf(interest_rate_data, alpha=1, lags=12, ax=axes[0])

# Plot the autocorrelation of the simulated random walk series in the bottom plot
fig = plot_acf(simulated_data, alpha=1, lags=12, ax=axes[1])

# Label axes
axes[0].set_title("Interest Rate Data")
axes[1].set_title("Simulated Random Walk Data")
plt.show()
AR(k) Order Estimation
估计k,即模型阶数
Identifying the Order of an AR Model:
- The order of an $\mathrm{AR}(\mathrm{p})$ model will usually be unknown
- Two techniques to determine order
- Partial Autocorrelation Function
- Information Criteria
Partial Autocorrelation Function(PACF)
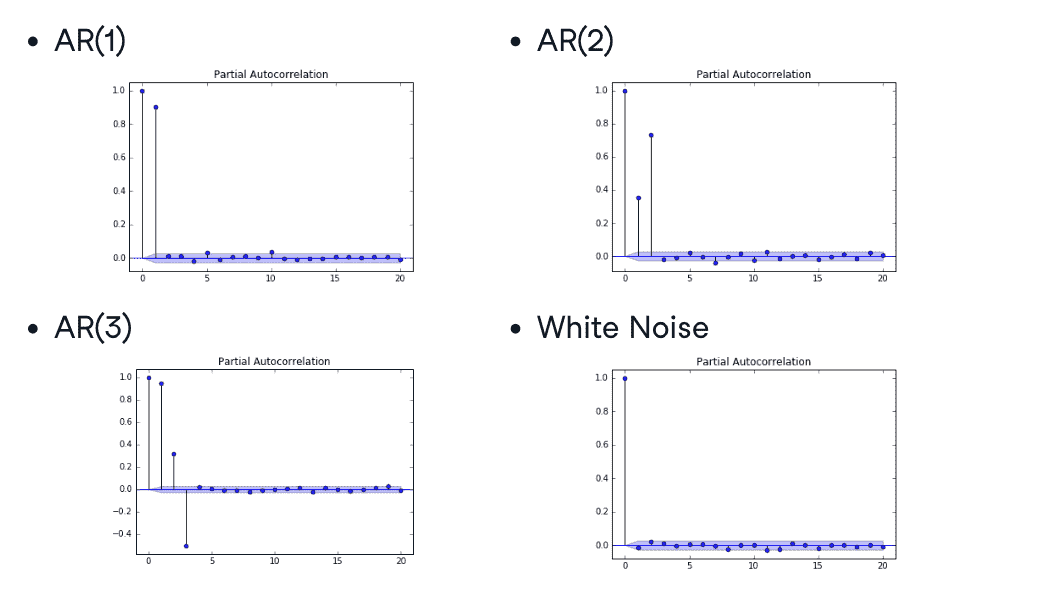
逐步测量添加下一个lag时候的自相关系数,可以用于确定模型的阶数
ACF测量一个时间序列在不同时间滞后下的自相关性,而PACF衡量特定滞后时间对序列的影响,并帮助确定哪些滞后时间是显著的。

from statsmodels.graphics.tsaplots import plot_pacf
plot_pacf(x,lags=20,alpha=0.05)
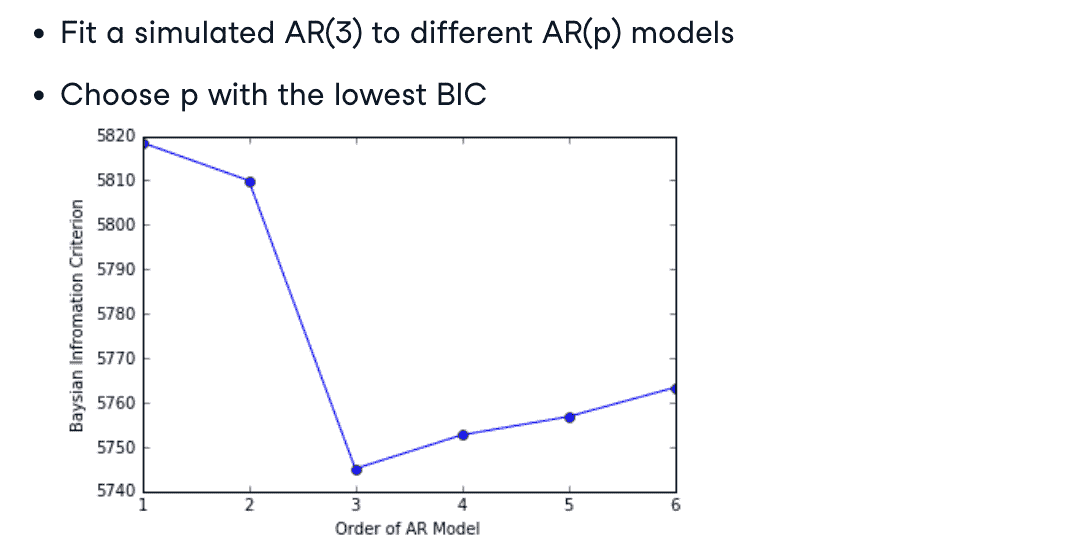
Information Criteria
防止过拟合

from statsmodels.tsa.arima.model import ARIMA
mod = ARIMA(data,order=(1,0,0)) // order = (p,d,q), 代表ar步长、d代表差分阶、q代表ma
result = model.fit()
print(result.aic)
print(result.bic) # 选择最低信息标准的模型
Moving Average (MA) Model
MA(k)
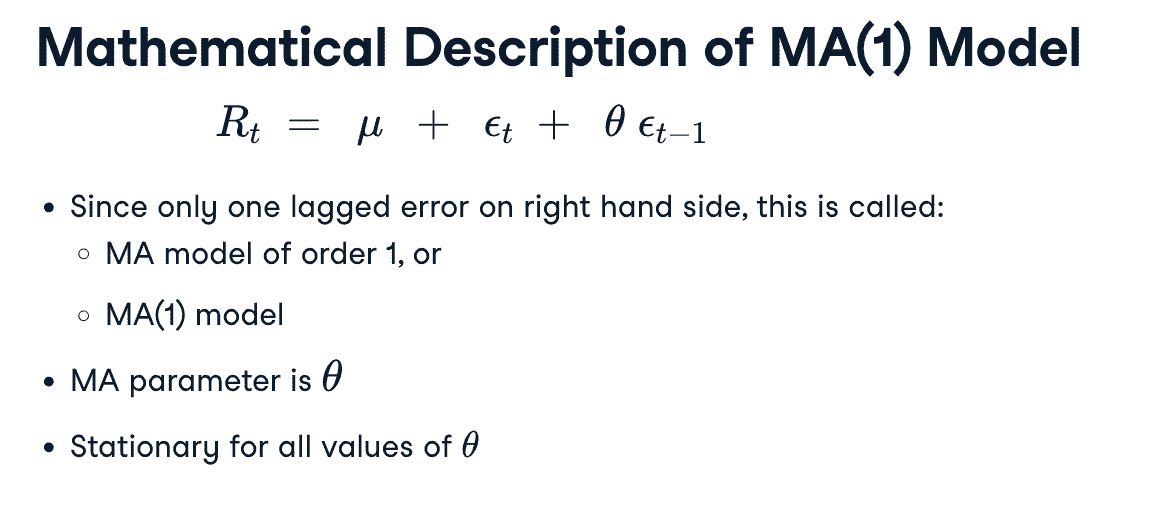
- MA(1) model

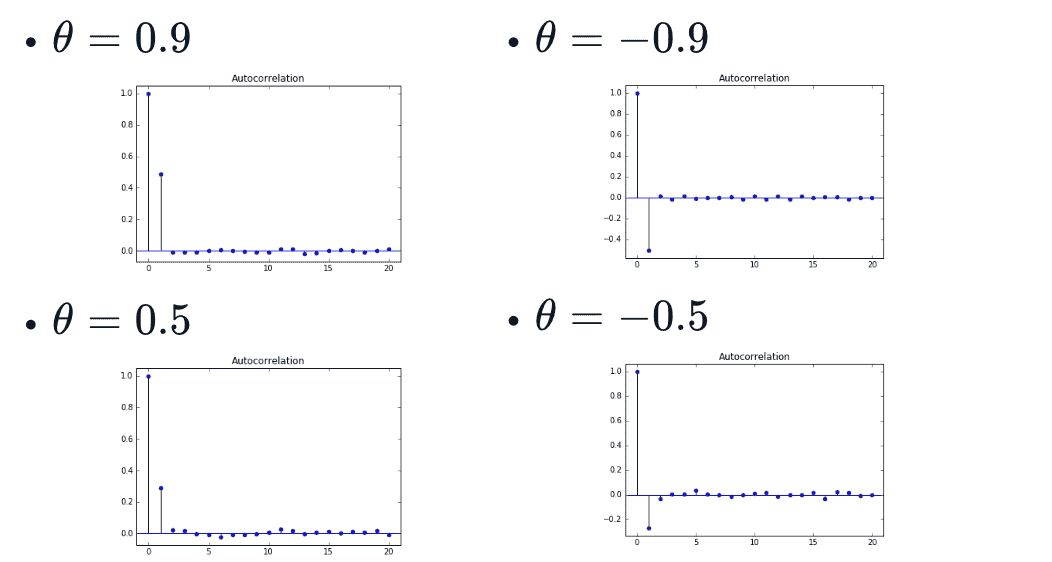
- sample
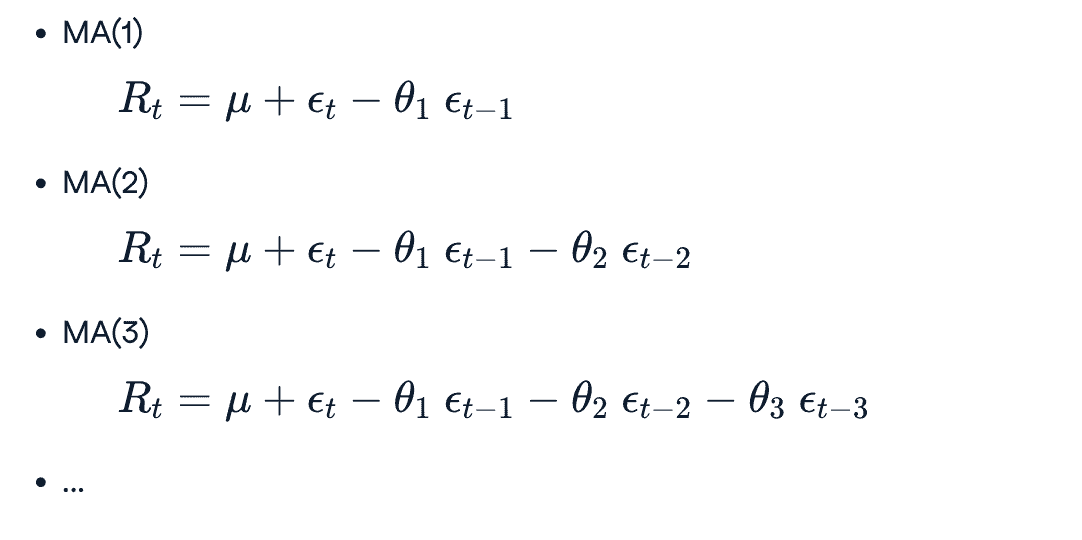
- Higher order MA models
from statsmodels.tsa.arima_process import ArmaProcess
ar = np.array([1])
ma = np.array([1,0.5])
AR_object = ArmaProcess(ar,ma)
simulated_data = AR_object.generate_sample(n_sample=1000)
plt.plot(simulated_data)
Estimating and Forecasting MA model
和估计AR模型使用同一个模块
- Estimate
from statsmodels.tsa.arima.model import ARIMA
mod=ARIMA(simulated_data,order=(0,0,1))
result = mode.fit()
- Forecast
from statsmodels.graphics.tsaplots import plot_predict
fig,ax = plt.subplots()
data.plot(ax=ax)
plot_predict(result,start='2012-09-27',end='2012-10-06',ax=ax)
plt.show()
ARMA Model
- $\operatorname{ARMA}(1,1)$ model:
- Converting between ARMA, AR, MA model:
Eg: converting AR(1) into an MA($\infin$):
$\begin{aligned} & R_t=\mu+\phi R_{t-1}+\epsilon_t \ & R_t=\mu+\phi\left(\mu+\phi R_{t-2}+\epsilon_{t-1}\right)+\epsilon_t \ & \vdots \ & R_t=\frac{\mu}{1-\phi}+\epsilon_t+\phi \epsilon_{t-1}-\phi^2 \epsilon_{t-2}+\phi^3 \epsilon_{t-3}+\ldots\end{aligned}$
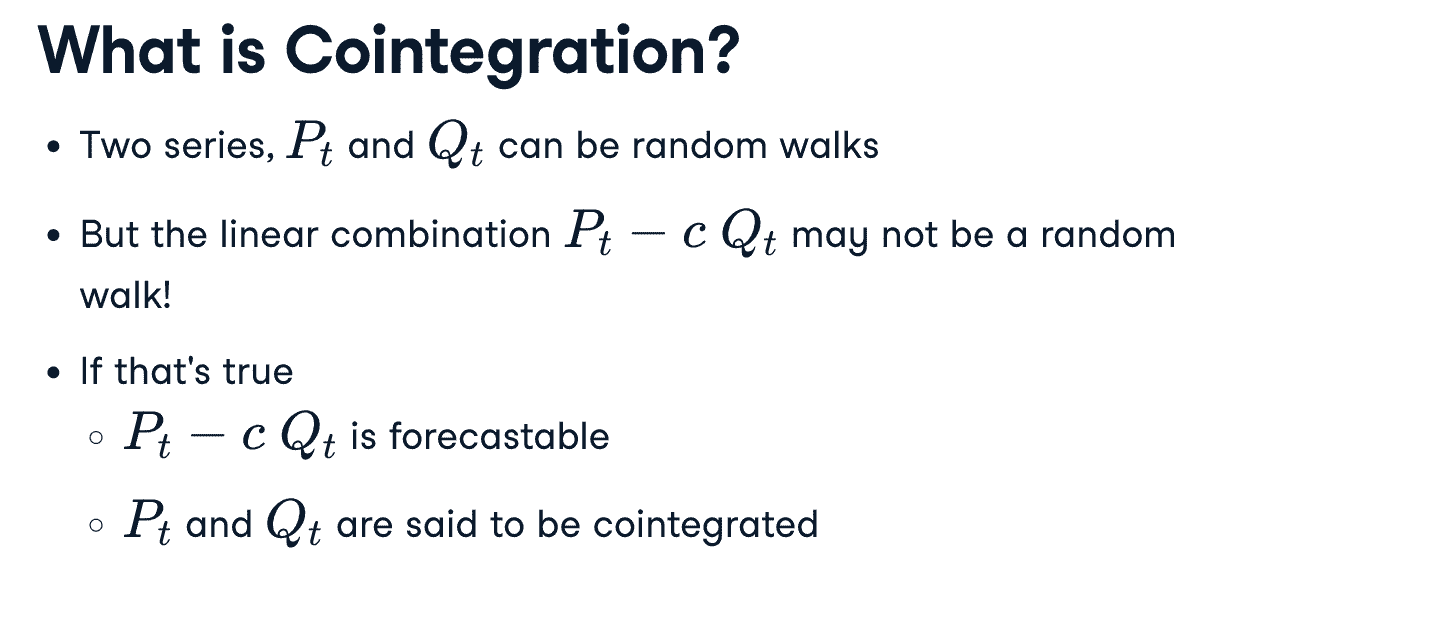
Cointegration Model
举个例子:
- $P_t=$ Owner
- $Q_t=\operatorname{Dog}$
- Both series look like a random walk
- Difference, or distance between them, looks mean reverting
- If dog falls too far behind, it gets pulled forward
- If dog gets too far ahead, it gets pulled back
检测 Cointegration
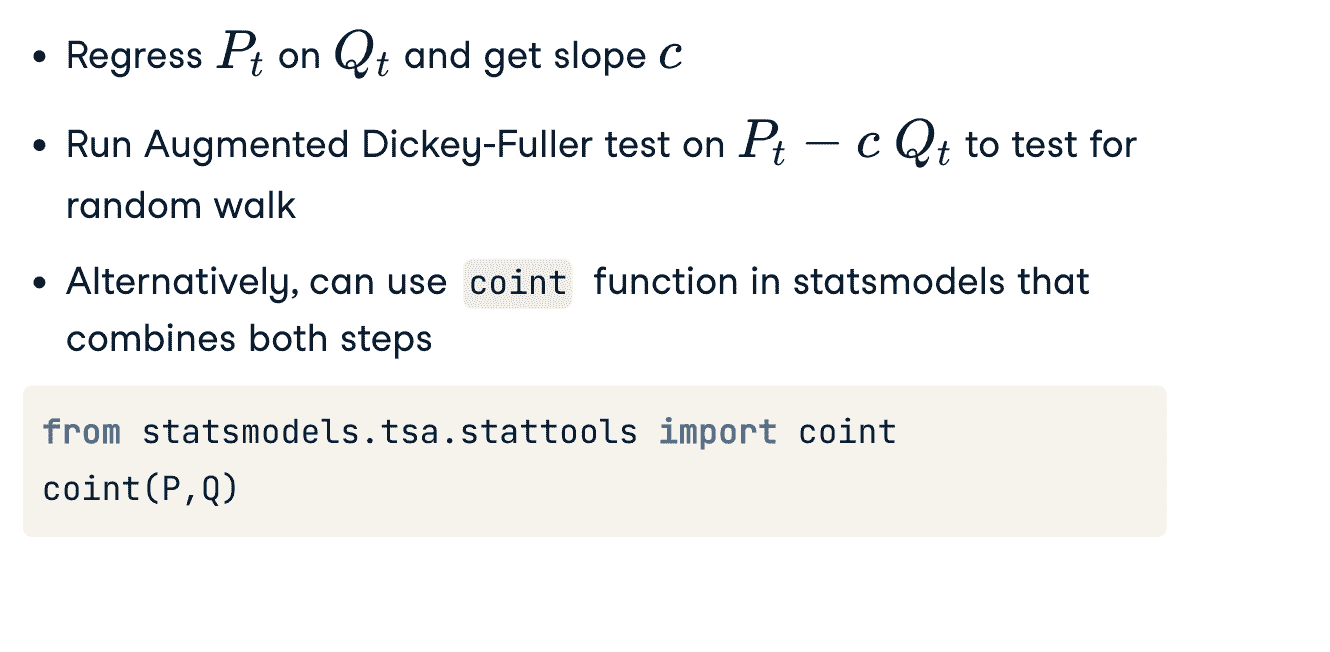
# Import the statsmodels module for regression and the adfuller function
import statsmodels.api as sm
from statsmodels.tsa.stattools import adfuller

# Regress BTC on ETH
ETH = sm.add_constant(ETH)
result = sm.OLS(BTC,ETH).fit()

# Compute ADF
b = result.params[1]
adf_stats = adfuller(BTC['Price'] - b*ETH['Price'])
print("The p-value for the ADF test is ", adf_stats[1])
Advanced Topics
- GARCH Models
- Nonlinear Models
- Multivariate Time Series Models
- Regime Switching Models
- State Space Models and Kalman Filtering
- …
